Reowning the Damage: Giving Abstract Data a Physical Form
The dominant culture in the global north, often called the “culture of uncare” is weakening our natural ability to care about the long-term consequences of our actions. This culture promotes a lifestyle shaped by a globalized, deregulated economy where polluters rarely face consequences, short-term profits take priority, and the true costs of consumption are ignored (Weintrobe, 2024). It fosters indifference and undermines values of empathy and responsibility, making it harder to address critical issues like climate change. Products we buy daily often come with hidden ecological costs, impacting environments and communities far beyond our own. Changing this pattern requires first recognizing how deeply we are immersed in it. We need to step back to see the broader picture and step closer to feel the real impact of these smaller, everyday choices.
One consequence of this “culture of uncare” is that it makes it harder to think clearly about our responsibility and guilt regarding environmental harm. Often, we feel entitled to consume freely while also wanting to protect the environment—a contradiction that reflects how deeply ingrained this culture has become. Speculate Everything by Dunne and Raby (2013) argues that critical design should challenge these kinds of contradictions by questioning accepted values and assumptions. By showing alternative perspectives, it can encourage us to imagine a world where everyday life looks different, offering us a way to think about and ultimately reshape the habits we take for granted.
Data visuals on critical topics, like environmental harm, often come across as distant, unrelatable, and difficult to grasp. These complex datasets, presented in abstract forms, can unintentionally support a culture of uncare by leaving us feeling detached—just spectators to the data rather than active participants within it. When faced with statistics and figures that lack any direct physical reference, we might intellectually acknowledge the numbers, but rarely do we feel them. This disconnect discourages empathy and leaves us feeling that we have little stake in the issue.
Through my experiments, I aimed to bridge this gap by creating visuals that resonate on a human scale, giving abstract data a relatable, tangible presence. Adding a familiar frame of reference can transform distant data into something people can easily connect with. As an example, rather than measuring a product’s water footprint in liters, I translated it into a recognizable, everyday measure: bathtubs. This reframing exposed the hidden cost of common items in a way that feels immediate. Producing a single Big Mac meal, for example, requires the equivalent of eight bathtubs of water. A visual like this, showing filled bathtubs, makes the water footprint seem real and immediate, unlike abstract figures in liters alone. The hidden water footprint of other everyday items reveals similarly staggering figures when measured in familiar terms. A single beef steak, for instance, requires about 17 bathtubs of water to produce. A cotton T-shirt consumes roughly 16 bathtubs, while a single pair of jeans demands an astonishing 53 bathtubs of water. When viewed this way, these figures no longer feel like distant abstractions; they become tangible representations of the hidden environmental cost embedded in our daily lives.
Water Footprint of a Bigmac Menu is equal to 8 bathtubs.
This approach highlights the idea of ecological debt—the relationship between what we consume and its hidden environmental costs. This concept reveals a connection between the lifestyles in developed countries and the costs imposed on the natural world and other communities. As Weintrobe suggests, ecological debt offers a way to see who uses what natural resources and who owes a debt to whom. Unlike financial debts, ecological debts are absent from corporate and individual accounts, with no plans for repayment (Weintrobe, 2024). These debts can be owed to other people, species, future generations, and the global commons, which includes resources like air and oceans that benefit all but belong to no one.
Inspired by The Powers of Ten, a short film by Charles and Ray Eames that shifts perspectives through scaling, I wanted to find ways to bring the enormity of such emissions into a tangible frame (Eames, 1977). Visualizing these billion tonnes of carbon in familiar, relatable forms could help us understand the massive scale of our daily contributions.
The most obvious ecological debt today is caused by rising carbon emissions. In 2023 alone, human activity generated 57.1 billion tonnes of carbon emissions, mainly from energy production, deforestation, industrial activities, and excessive consumption (UNEP, 2024). To explore my personal impact, I calculated my own carbon footprint using the WWF’s carbon calculator, which amounted to 9 tonnes of carbon per year (WWF, 2024). To give this a physical form, I translated the tonnes of carbon into pixels, using a single pixel as the unit of measurement. If my emissions were represented by 9 pixels, the total global annual emissions would require 57.1 billion pixels. However, this is still an abstract number. To make it more tangible, I reframed it by using an A4 sheet of paper (which contains 8.7 million pixels at 300 dpi) as a reference. When translated into this familiar form, global emissions became a 6,563-page A4-sized “carbon book.”
“CARBON BOOK” CONcEPT
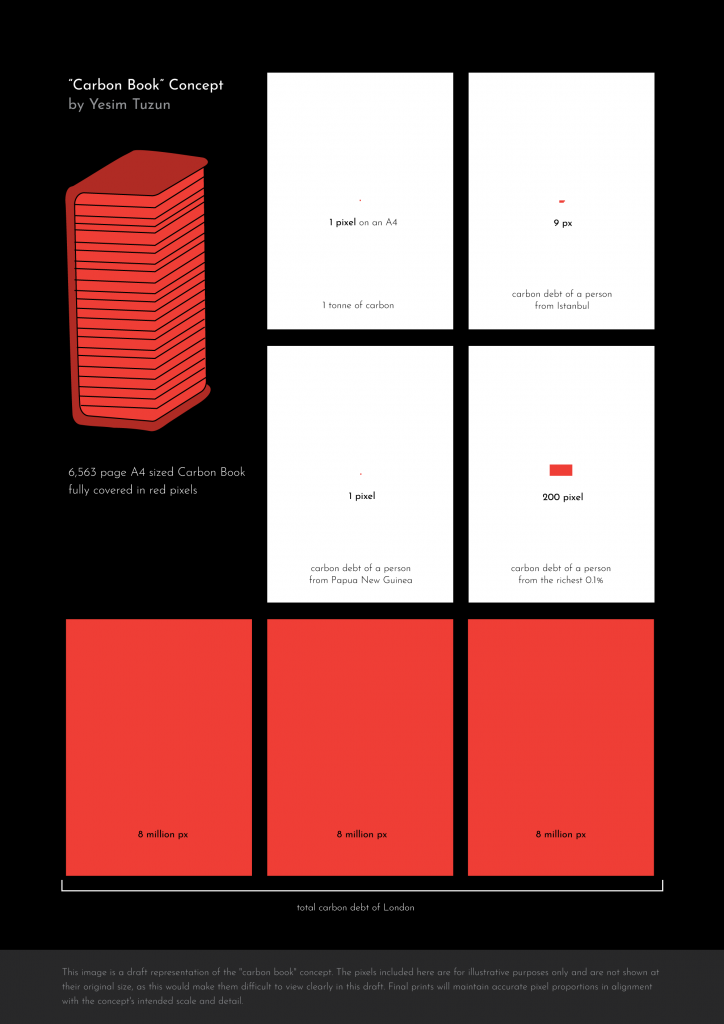
This reframing exercise demonstrates how making abstract data more relatable can clarify the scale of both personal and collective impact. Shifting scale allows us to move back and forth between personal and global views, helping us visualize where our actions fit within the larger environmental picture. It brings difficult-to-visualize numbers down to something that can be physically understood. Revisiting the central question—how can we make complex data relatable and motivational?—the answer lies in using graphic communication to give abstract data a physical presence, drawing people into a personal experience of collective impact. Transforming vast figures into familiar forms helps us see the environmental consequences of our choices as a collective story in which each of us has a part. This perspective not only helps us understand individual contributions but also encourages a shift toward a more sustainable future, hopefully.
References:
Weintrobe, S. (2013). Engaging with climate change : psychoanalytic and interdisciplinary perspectives. Abingdon ; New York: Routledge.
Dunne, A. and Raby, F., 2013. Speculative Everything: Design, Fiction, and Social Dreaming. Cambridge: MIT Press.
Eames, C. and Eames, R. (1977). Powers of TenTM (1977). YouTube. Available at: https://www.youtube.com/watch?v=0fKBhvDjuy0
UNEP, 2024. Emissions Gap Report 2024. United Nations Environment Programme.
WWF (2019). WWF Footprint Calculator. [online] Wwf.org.uk. Available at: https://footprint.wwf.org.uk/